
Click on graphic to embiggen.
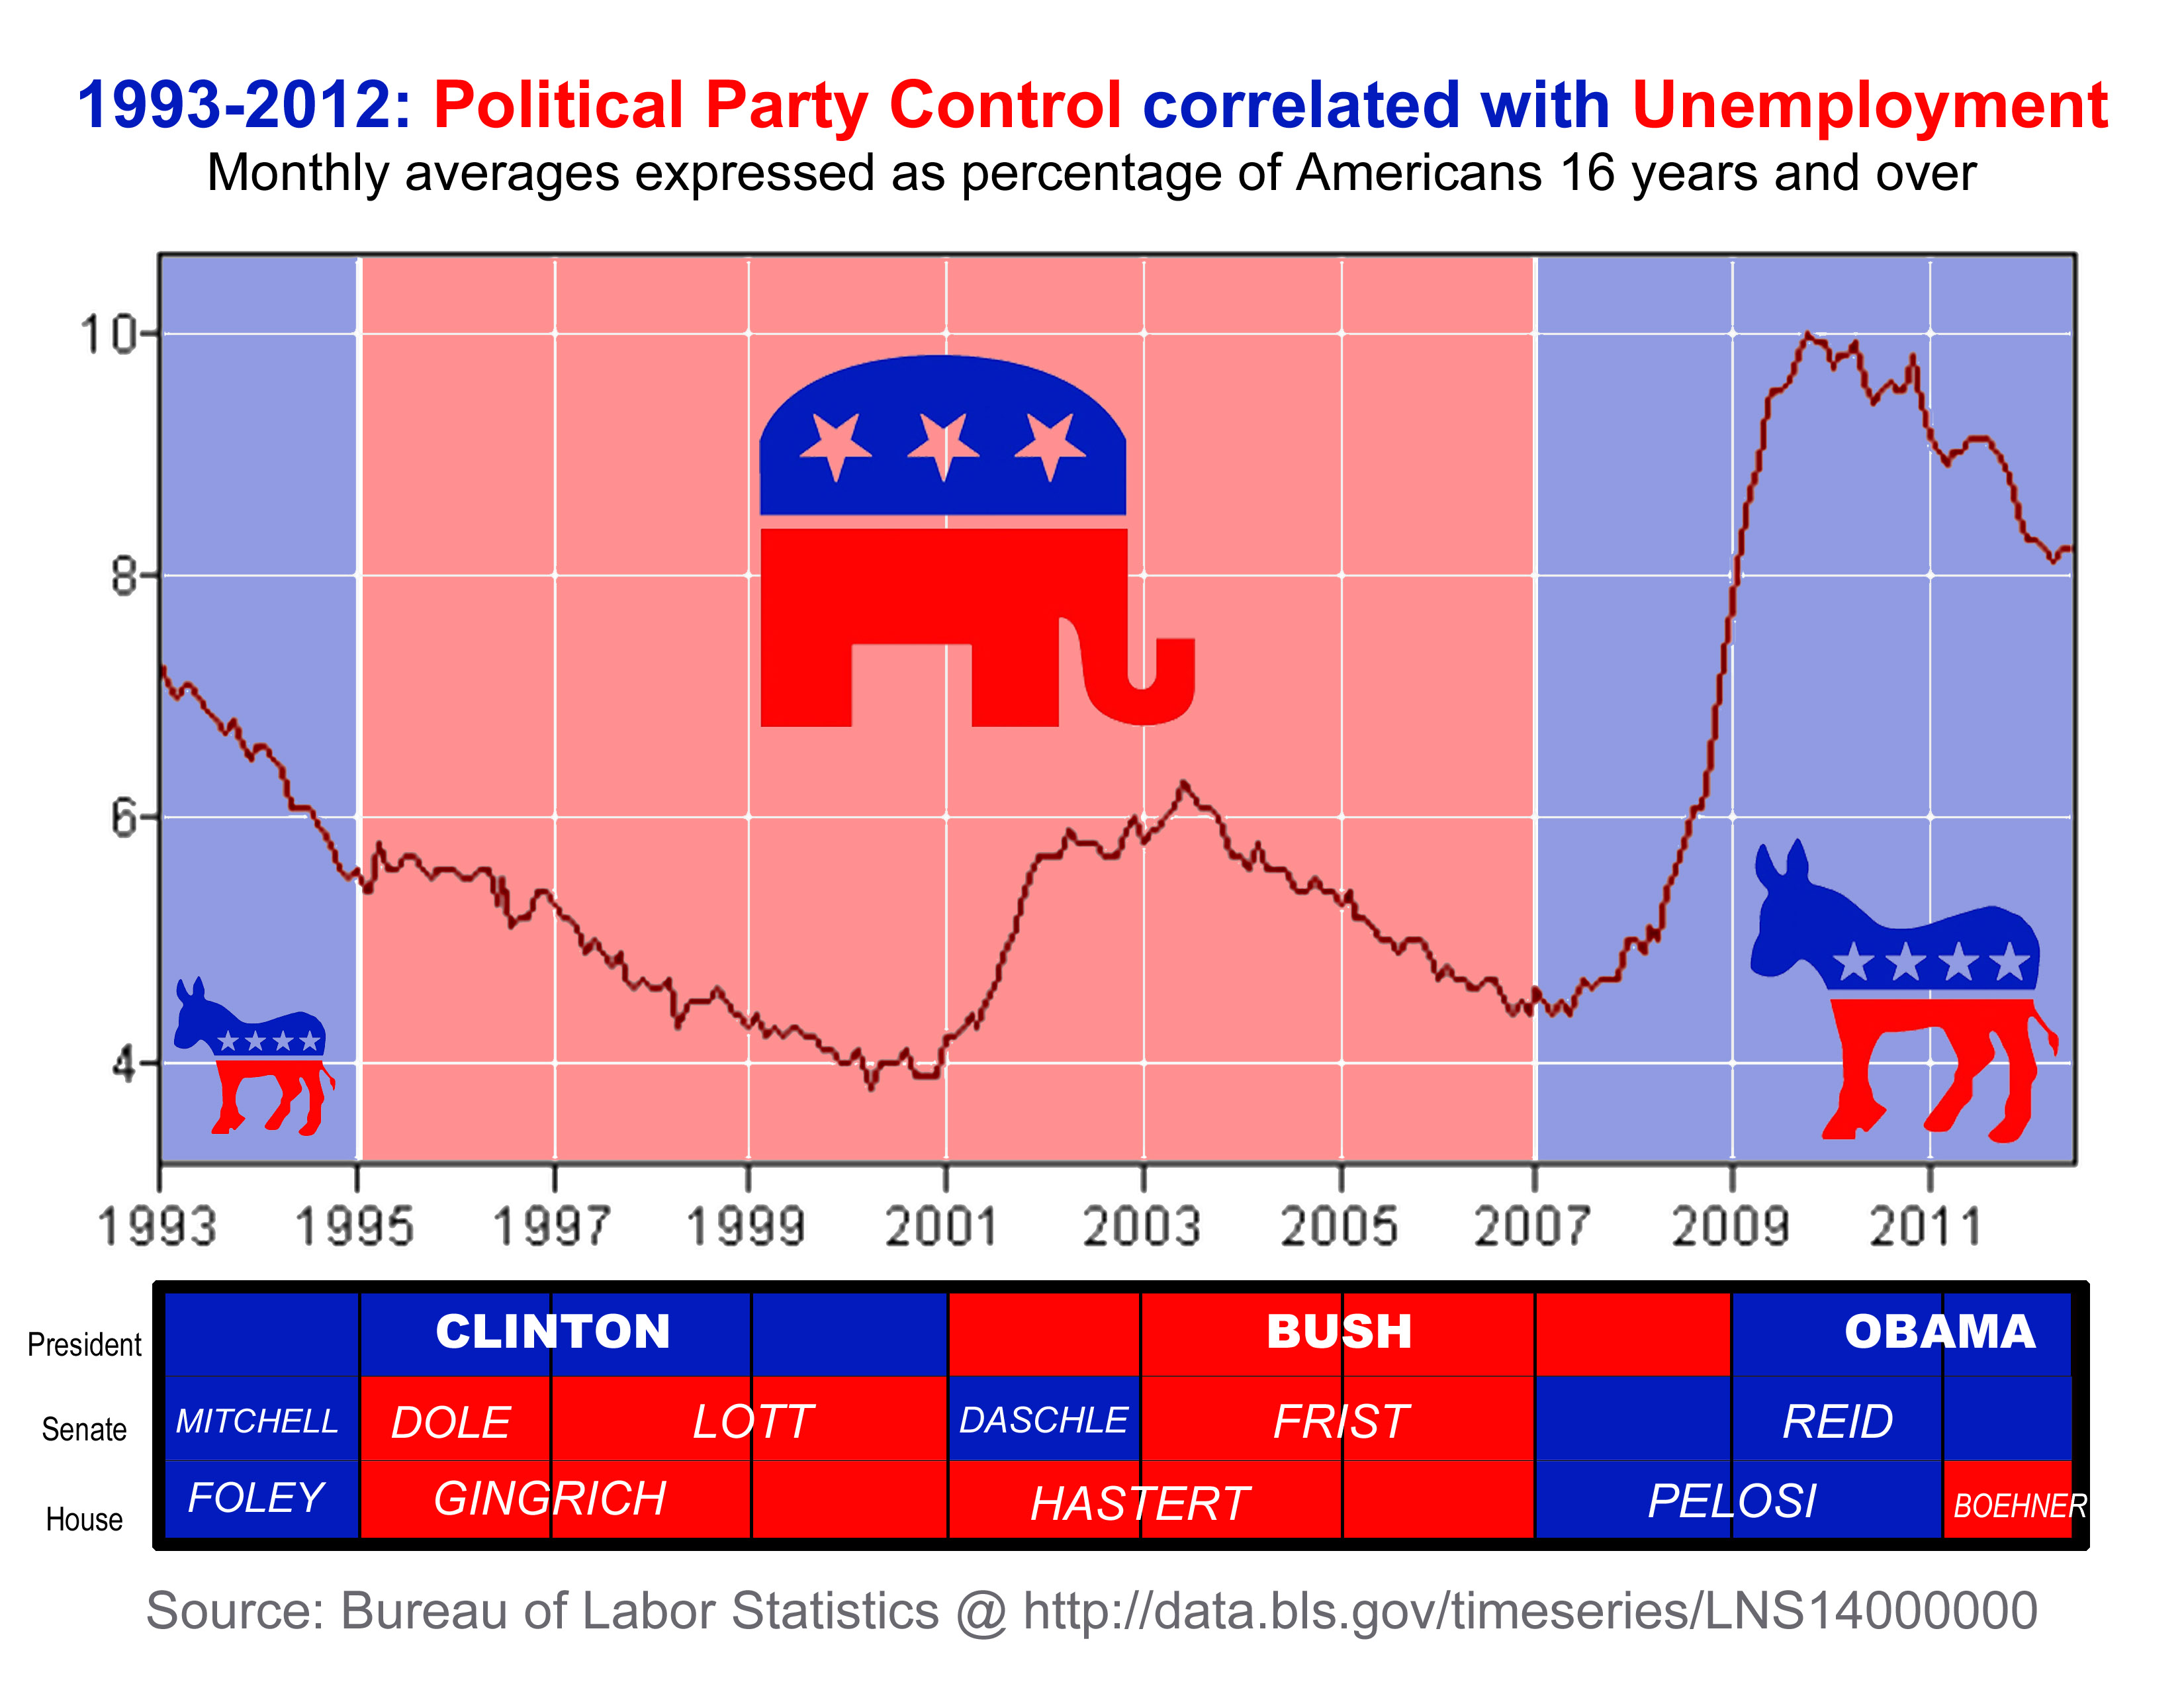
Source: Bureau of Labor Statistics @ http://data.bls.gov/timeseries/LNS14000000
Click on graphic to embiggen.
Source: Bureau of Labor Statistics @ http://data.bls.gov/timeseries/LNS14000000
Filed under Democrats, Republicans, Unemployment


| bluebird of bitterne… on Bits & Bytes | |
| mindful webworker on Bits & Bytes | |
| chrissythehyphenated on Bits & Bytes | |
| mindful webworker on Bits & Bytes | |
| chrissythehyphenated on Bits & Bytes | |
| mindful webworker on Bits & Bytes | |
| chrissythehyphenated on Bits & Bytes | |
| mindful webworker on Bits & Bytes | |
| chrissythehyphenated on Bits & Bytes | |
| mindful webworker on Bits & Bytes | |
| mindful webworker on Bits & Bytes | |
| chrissythehyphenated on Bits & Bytes | |
| bluebird of bitterne… on Bits & Bytes |


Thank you for the graph, Chrissy!
People hear the unemployment rate in the news, but:
1) They aren’t usually given the longer-term perspective, and that the WORST month under Bush was better than the BEST month under Obama.
2) They usually think that Obama “inherited” a bad economy on January 20, 2009, when the truth is that the Democratic majority in Washington, D.C. (which included then-Senators Obama, Biden, and Clinton) inherited a GOOD economy on January 3, 2007.
But even these reported “unemployment” numbers are deceptive, because while the population age 16 and over has grown every month, the reported percentage of the population that is considered “in the workforce” has been steadily declining ever since Obama became pResident:
Series Id: LNS11300000

Seasonally Adjusted
Series title: (Seas) Labor Force Participation Rate
Labor force status: Civilian labor force participation rate
Type of data: Percent or rate
Age: 16 years and over
That makes the unemployment number appear to be improving:
When the reality is that employment, relative to population, has been essentially flatline for the last three years:
Series Id: LNS12300000

Seasonally Adjusted
Series title: (Seas) Employment-Population Ratio
Labor force status: Employment-population ratio
Type of data: Percent or rate
Age: 16 years and over
LikeLike
Chrissy, would it be fairly easy to create a graphic just like the one above but using Employment rather than Unemployment?
The Unemployment number allows the “fudge factor” of manipulating who is and is not considered “in the workforce”, while the Employment number does not allow that “fudge factor” (and is, in my opinion, a more honest and straightforward metric).
LikeLike
These are really eye-opening graphics. I think that employment chart might have people jumping out of windows like in 1929 if it were of the stock market instead.
LikeLike
Pingback: Sugar Daddy in Chief | PoliNation
Chrissy,
Something happened to the graphic in the post above… it’s no longer there…
LikeLike
It must’ve been accidentally deleted from our media library. I reloaded it. Also clicked the Site Bites link. Webshots is gone, so none of those links will work anymore. :oP“`
LikeLike
You must be crushed about the Webshots links all no longer working. You would think that the new owners would have an interest in backwards compatibility!
LikeLike
The “Click on graphic to embiggen” wasn’t working for the new graphic, so I hope you don’t mind that I edited the post to add the link…
LikeLike