
The Left preaches as a point of faith that Republicans are EEEVIL because we support something called “trickle-down economics.”
But “preaching” and “faith” are as close as you can get to justifying their oft-repeated statement.
The fact is that nobody supports “trickle-down economics” because there is no such thing!
It exists nowhere except in the “Republicans are EEEVIL” rantings of Democrat politicians and their lapdog talking heads.
Even if you limit the definition of this non-existent theory to something like “high taxes are bad for the economy,” you still don’t get to a Republicans-only place.
Democrat Presidents Kennedy and Wilson BOTH said high taxes are bad for the economy.
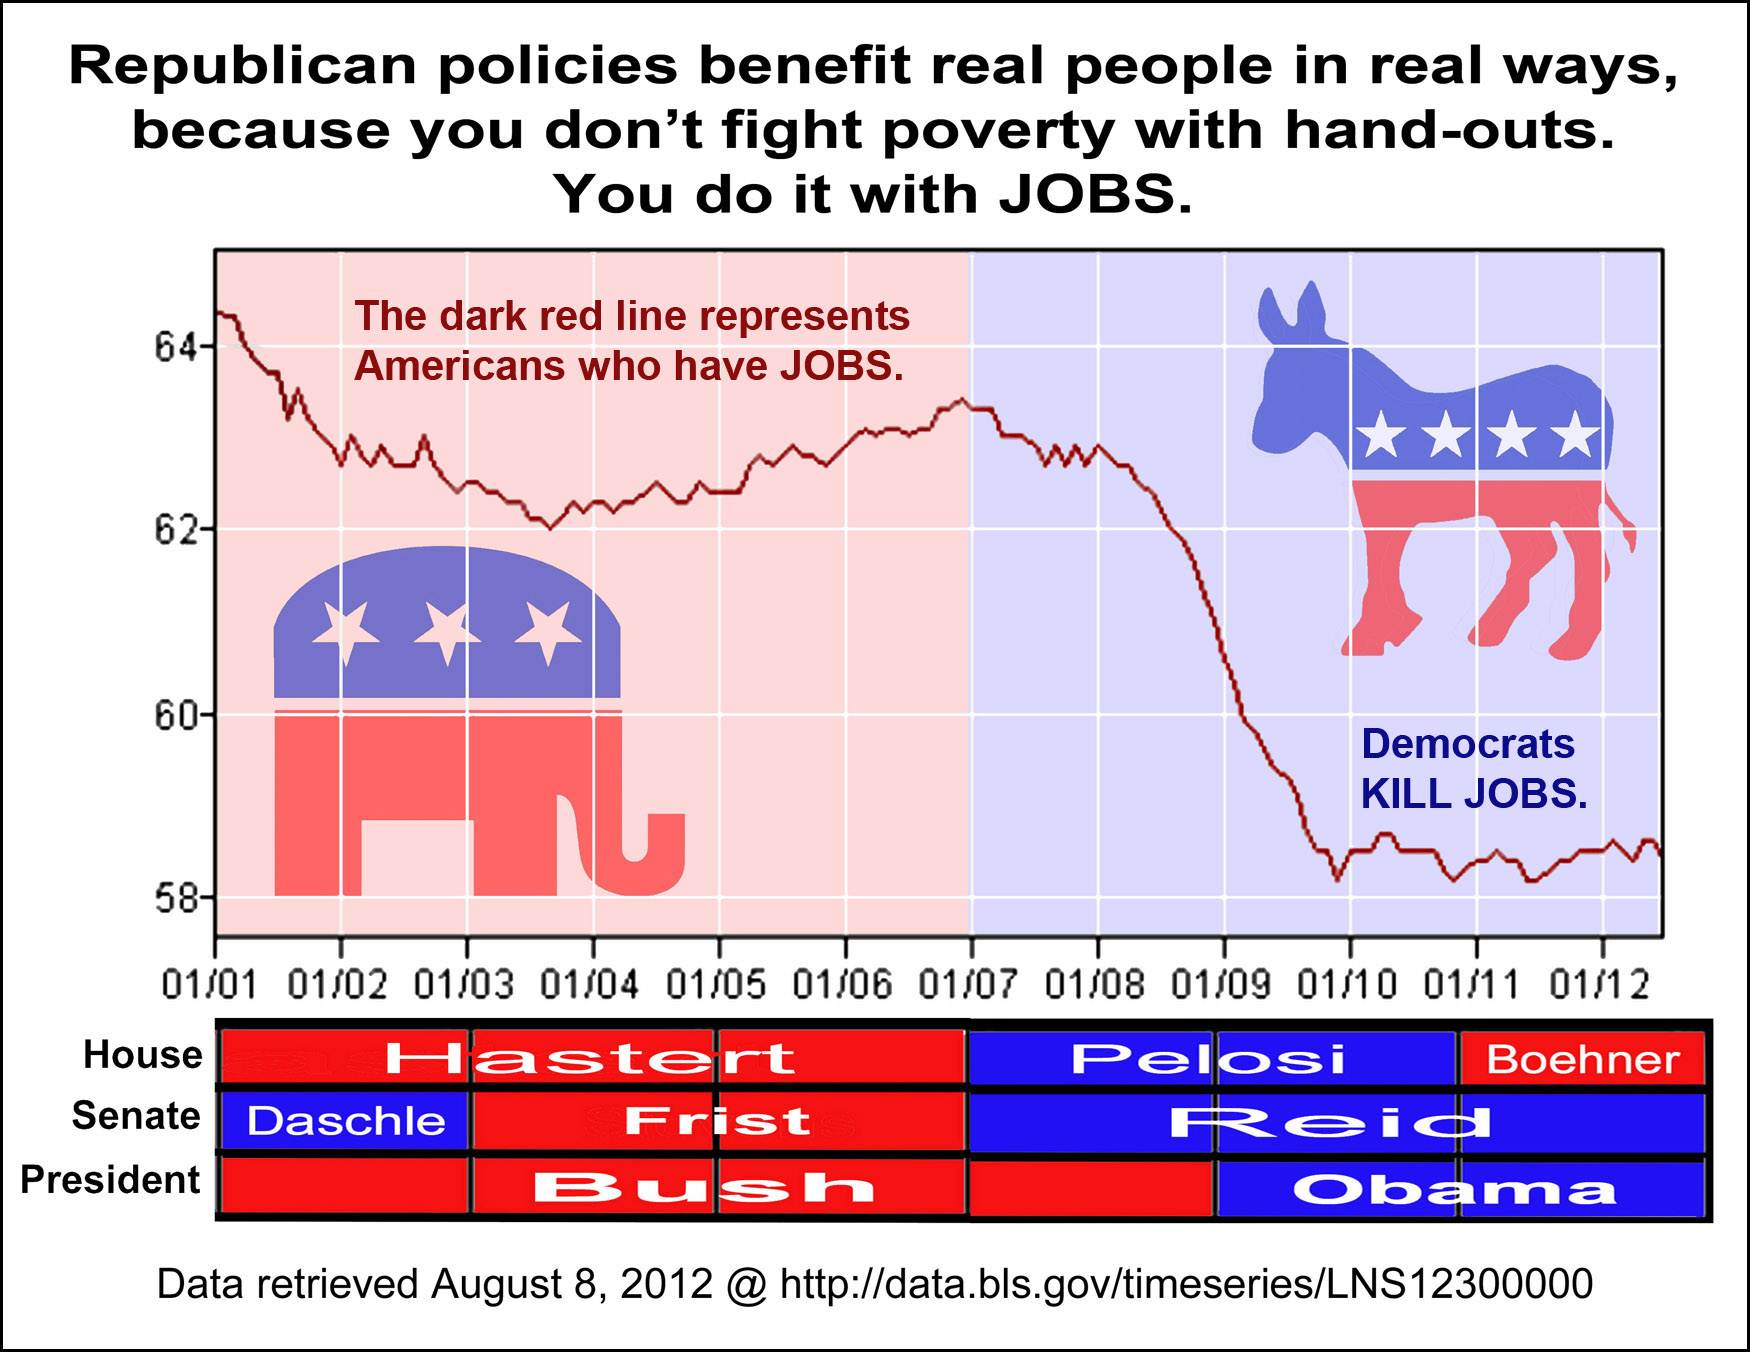
What the Left wants us to infer from their trickle rantings is that it is Democrat, not Republican policies that boost people out of poverty.
The historical record shows just the opposite.
Sources:
The ‘Trickle-Down’ Lie by Thomas Sowell – January 7, 2014


Good chart. I’d add this comment: Democrats took over Congress in 2006. The results of their policies began to be felt in 2007, which coincides with the decline of the employment rate. Coincidence?
LikeLike
Democrats won the Nov 2006 elections, and took over Congress on 1/3/2007.
Compare employment during the four years before and after 1/3/2007…
1/3/2003 – 1/3/2007: Republicans controlled the House & Senate, and employment improved.
1/3/2007 – 1/3/2011: Democrats controlled the House & Senate, and employment was driven into a ditch.
LikeLike
Dating a particular session of Congress can get messy, because elections occur in November, while sessions technically stretch from the January after the election to the January after the next election.
So we talk about the 2006 mid-term elections, but that group of elected officials did not take their oaths until January 2007.
And while they technically were still in office until their successors took their oaths in January 2009, they were actually out on Christmas recess or cleaning out their offices or whatever.
To spares my brain excessive numbers confusions, I adopted a consistent system that I use for all my graphics where each session of Congress is dated from the year of the first oath to the year of the next election.
E.g., The 2006 mid-term elections for the 110th Congress occurred on November 7, 2006. The members of the 110th Congress took their oaths January 3, 2007 and were technically in office until January 3, 2009. I date the 110th Congress simply as 2007-2008.
http://en.wikipedia.org/wiki/111th_United_States_Congress
This system makes it easier to line up sessions of Congress and color in the political party dominance on annual graphs of things like poverty and employment rates.
https://www.facebook.com/christine.bravomom/media_set?set=a.286938824787666.1073741874.100004146523282&type=3
LikeLike
Good point. Good chart.
LikeLike
Employment-Population Ratio, Correlated with Majority Party, Jan 1995 – Dec 2013
LikeLike