
CLICK https://www.facebook.com/watch?v=1382093165600544 to hear Speaker Pelosi shamelessly lie about Democrat financial policies and history. Below is the true history.
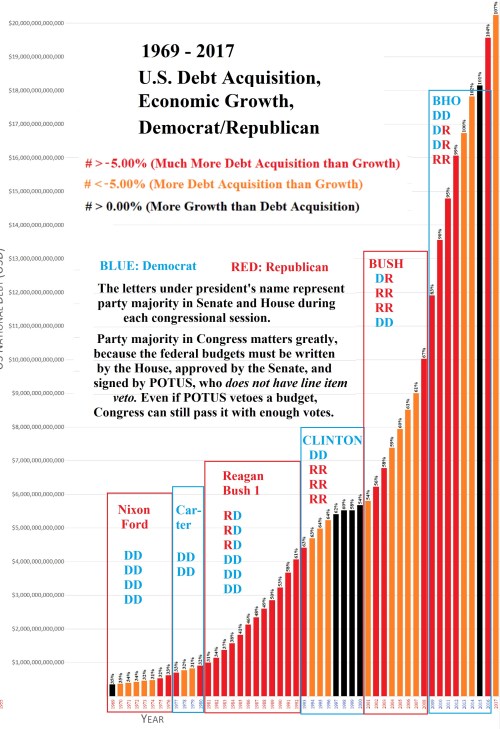
When examining this graph, please keep in mind that the red columns on the bar graph do not represent Republican spending. They represent the worst years for increased federal spending – i.e., red ink.
The less worse years are orange and the least worse years are black. There aren’t any good years, because Congress has been deficit spending since before 1930, when the full graph (link below) begins.
To reveal Nancy’s Big Fat Lie, compare the balance of red and orange columns with the predominance of blue Ds. Especially note that where Pelosi wants to take credit for the black bars during the latter Clinton years, those budgets were the work of an all Republican Congress under the leadership of Newt Gingrich.
As for her absurd claim that they reduced spending under Obama, puh-leeze. The increases were astronomical and did not slow down until Republicans got some traction in Congress.


Dad said of Carter, I lived thru the Great Depression, then FDR wrecking things, and now this? And people wonder why no one in the family will vote for a dem or a RINO.
LikeLiked by 1 person