
Republicans tried to prevent the sub-prime mortgage crisis.
It was Democrats who passed the Community Reinvestment Act, Democrats who expanded it, Democrats who cooked the books at Fannie and Freddie as other Democrats pressured banks to make more and more of those high-risk loans, and Democrats who prevented Republican attempts at reform:
Democrats Covering up the Fannie Mae, Freddie Mac [8:37]
As for employment, let’s look at the big picture.
EMPLOYMENT UNDER REPUBLICAN LEADERSHIP
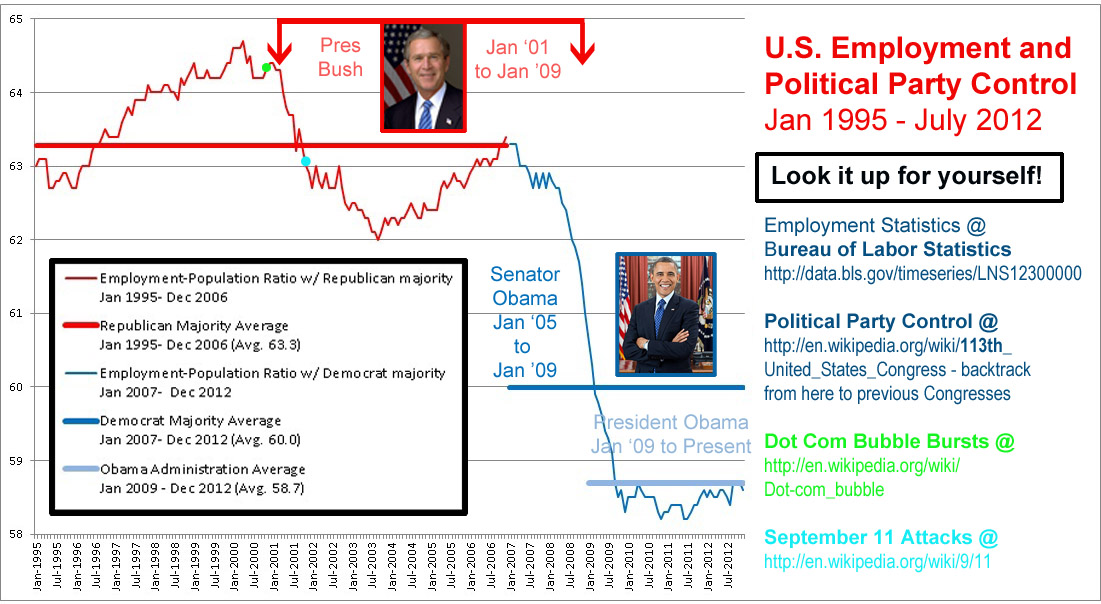
For 12 continuous years, Republicans held majority control of Washington, D.C. (they held 2+ out of 3 of the House, Senate, and Presidency). During that time, the average level of employment over 144 straight months was 63.3%, and never went below 62.0%.
When George W. Bush took office in 2001, one could truly say that he “inherited” the economy, because he had not been a part of the Congress that helped create that economy. And what he inherited was the Dot Com bust, followed shortly thereafter by the 9/11/2001 attacks, which created an economic double whammy. Employment was decreasing in 2001, 2002, and early 2003, and it was not until the 2003 Bush Tax Cuts were signed into law that the economy turned around, employment rose, and tax revenues rose along with that rising employment.
- The low point of employment in 2003 was 62.0% in September 2003.
- By December 2006, employment was up to 63.4%.
Thanks in large part to the Bush Tax Cuts, the economy grew, employment grew, and tax revenues grew. Tax revenues in FY 2007 were a whopping 44% larger than FY 2003 revenues! That was the effect of Republican-backed policies.
Again, employment in the last month of the Republican majority was 63.4%… even after inheriting the Dot Com bust and the 9/11 attacks, Bush was able to turn the economy around and finish the Republican majority with an employment percentage that was slightly higher than the 12-year Republican majority average (which was 63.3%).
That improvement hit an inflection point when the balance of power shifted from Republican to Democrat on January 3, 2007. Democrats raised the minimum wage 3 times, in 2007, 2008, and 2009, and while may sound good to you, the fact is that whenever the minimum wage is raised, some people who would have been employed at minimum wage previously do not end up making more, but rather end up unemployed. There is a reason why youth unemployment is higher now than it was 6 years ago. The financial crisis of 2008 of course increased unemployment (/decreased employment), but again Republicans had warned of, and tried to stop, that crisis, but Democrats thwarted attempts at reform and additional oversight.
EMPLOYMENT UNDER DEMOCRAT LEADERSHIP
We’ve now had six continuous years of Democrats holding majority control of Washington, D.C. Average employment over those six years has been 60.0%, and we haven’t had a month above that average since February 2009. The average over the four years of Obama’s first term was 58.7%, and we haven’t had a month above that average since August 2009.
When Democrats in Congress took majority control on January 3, 2007, they inherited a GOOD economy. And you can’t honestly say that Obama “inherited” the poor state of the economy on January 20, 2009, because he had been a Senator since January 3, 2005 and had helped to create that economy. And even if you insist on blaming Bush for the economy that Obama “inherited” on January 20, 2009, the fact remains that the economy Obama just inherited from himself is far, far worse!
[Originally posted by Red Pill in comments @ https://polination.wordpress.com/2013/01/20/fake-dog-whistles/. Bumped up to blog status by CtH, cuz it needs to be trumpeted from every rooftop from now until the Kingdom Comes!]


Glad you highlighted this excellent post by Red Pill!
Thanks for putting it all together.
Now if we could just get our progressive friends to actually listen.
Hey it is MLK birthday.
I Have A Dream . . .
LikeLike
It’s a good one! (Dream, I mean.)
LikeLike
Wow, I’m honored. Thank you, Chrissy!
LikeLike
For those interested, my comments were written in response to the following reader comment on my blog:
(My post* was from August 2012, but this reader’s comment was submitted yesterday, January 20, 2013)
*My post gave a big Hat Tip to you, Chrissy! 🙂
LikeLike
Chrissy, I really like what you did with this graph:
If you’re open to ideas for how to make it even better, please consider:
– Adding a bar with arrows (similar to the one done for Bush, but in blue) directly above or below Obama’s picture to show the correlation of his time as Senator and President.
– The thick blue line at 60.0 does not represent Obama’s time in the Senate, but rather the average employment % during the time Democrats have held majority control (January 2007 – present). The current proximity of Obama’s picture to this line might confuse some people to think that the blue line represents Obama’s time as senator (Jan 2005 – Dec 2008), but it doesn’t… Obama’s first two years as Senator were in the minority party, and his last two years as Senator (and all time so far as pResident) have been in the majority party.
– You could add a dot for the 2003 Bush Tax Cuts which were signed May 28, 2003. There was a little bit of lag time, as the low point of employment came four months later in September 2003, but from that point forward the economy was in recovery… until the Democrats took majority control and the recovery came to a halt in 2007, and recession came in 2008.
I hope you don’t mind the suggestions. I love what you are able to do with the graphics. 🙂
LikeLike
Thanks! I thought it might be useful for those of you who engage with the deceived if all the info, sources and excellent points you made were on one emailable, postable, printable graphic.
LikeLike
I think it is fair to give the majority of the credit and/or blame to the political party which controlls a majority of Washinton, D.C.
Hence, a majority of the credit that Clinton gets for the last six years of his Presidency really should be given to the Republican majority that held the House and Senate.
And a majority of the blame that Bush gets for the last two years of his Presidency really should be given to the Democrat majority that held the House and Senate.
But, even if you stick to looking only at who held the Presidency, here is the ranking of average Employment-Population ratio by Presidency for the last six Presidents:
63.4% Clinton Presidency (January 1993 – December 2000)
62.7% G.W.Bush Presidency (January 2001 – December 2008)
62.2% G.H.W.Bush Presidency (January 1989 – December 1992)
59.9% Reagan Presidency (January 1981 – December 1988)
59.1% Carter Presidency (January 1977- December 1980)
58.7% Obama Presidency (January 2009 – December 2012)
Obama is officially worse than Carter.
LikeLike
If only he’d also failed to get re-elected … sigh.
LikeLike
I know… it’s sad how many people believe the lie that “Republican policies” led to the economic problems in 2008.
Republican policies turned a recession (caused largely by the Dot Com bust and 9/11 attacks) into a recovery that was continuous for over three years… until the Democrats took majority control. Deficits were decreasing from FY 2004 to FY 2007 (the last budget that was passed by a Republican House, Republican Senate, and Republican President, and that FY 2007 budget featured a deficit of less than $161 Billion). Democrats sent deficits skyrocketing… today’s Democrat majority deficits are more than 8 times bigger, averaging $1.3 TRILLION per year!
Republicans sounded the alarm about, and tried to prevent, the sub-prime mortgage crisis, while Democrats obstructed reform and claimed that there were not any “safety and soundness issues” at Fannie and Freddie.
It’s Democrat policies that brought recession and no recovery.
Republican policies brought recovery.
But the MSM is a Democratic propaganda machine, and unfortunately a large part of our population believes those lies.
LikeLike
Each and every month of the Obama Presidency has “featured” an Employment-Population ratio that was lower than it ever was under President George W. Bush.
The worst month under Bush was better than the best month under Obama.
LikeLike
January 2013 was another below-average month, at 58.6%:
Data Source:
U.S. Bureau of Labor Statistics, Employment-Population Ratio
Chrissy, if you make another graphic with this updated data, can you incorporate my requests from my comment above on January 21, 2013 at 11:01 pm?
If you could, that would be great!
LikeLike
Wow.
LikeLike